Projections & KPIs
Projections
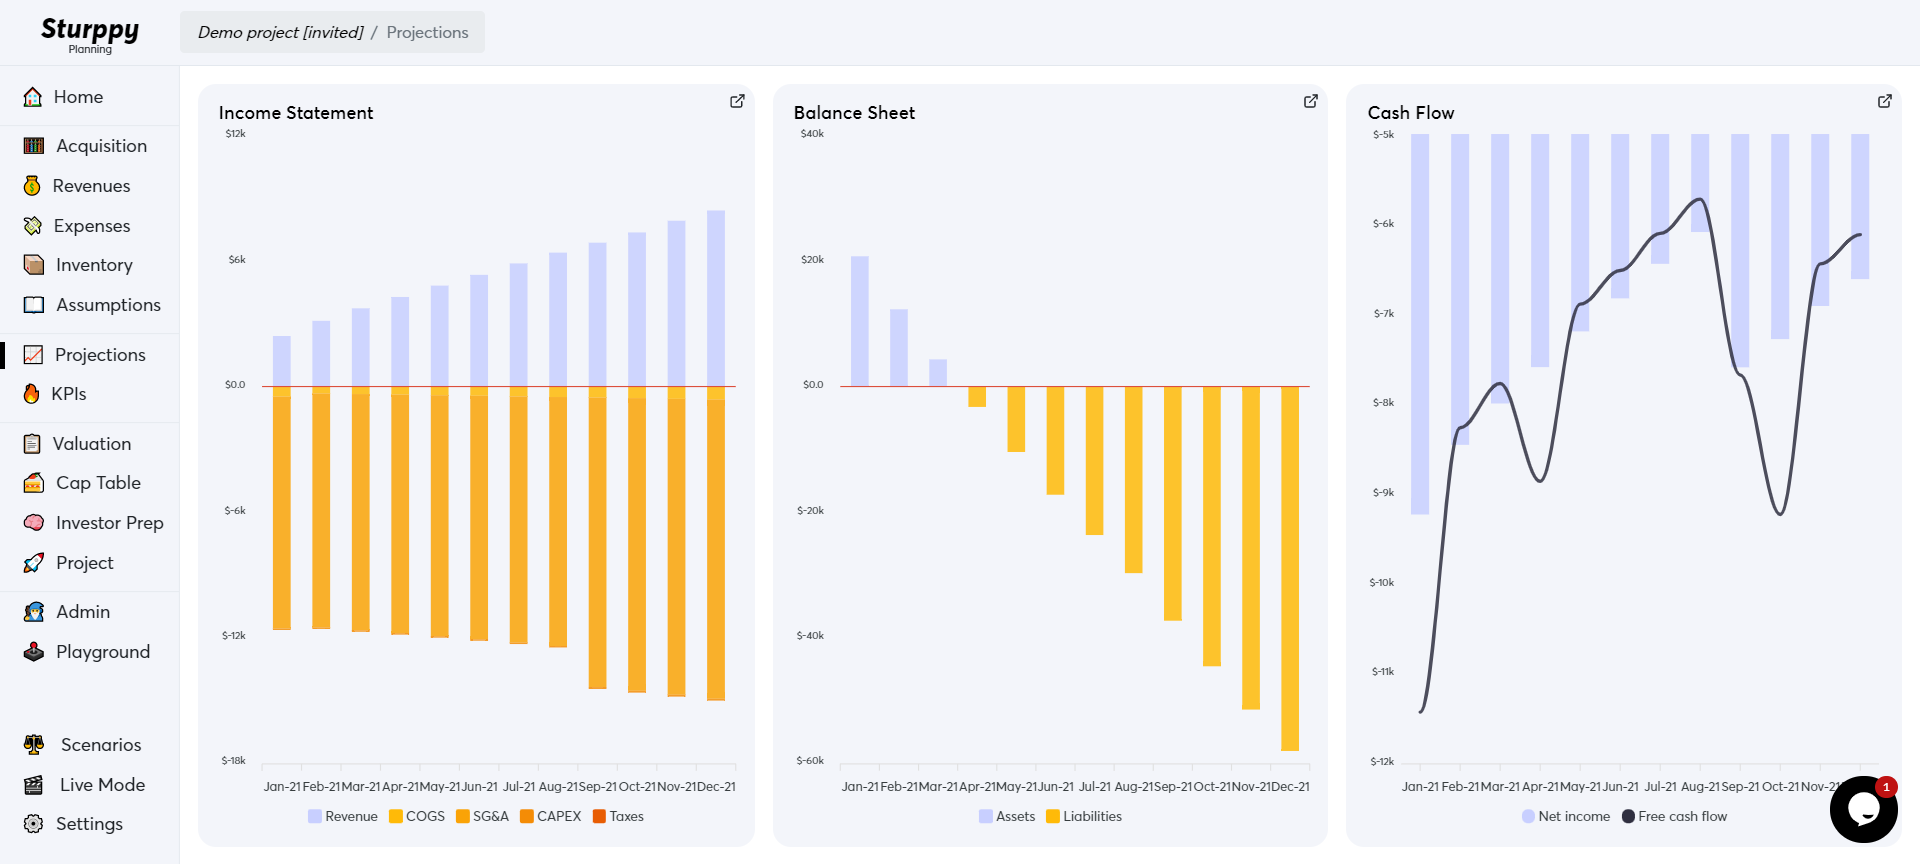
The Projections section, located on the Navigation bar, is a central location where you can access the 3 financial statements - Income Statement, Balance Sheet, and Statement of Cash Flows - that make up your model. When you click into Projections the first thing you'll see is graphs of the three statements:
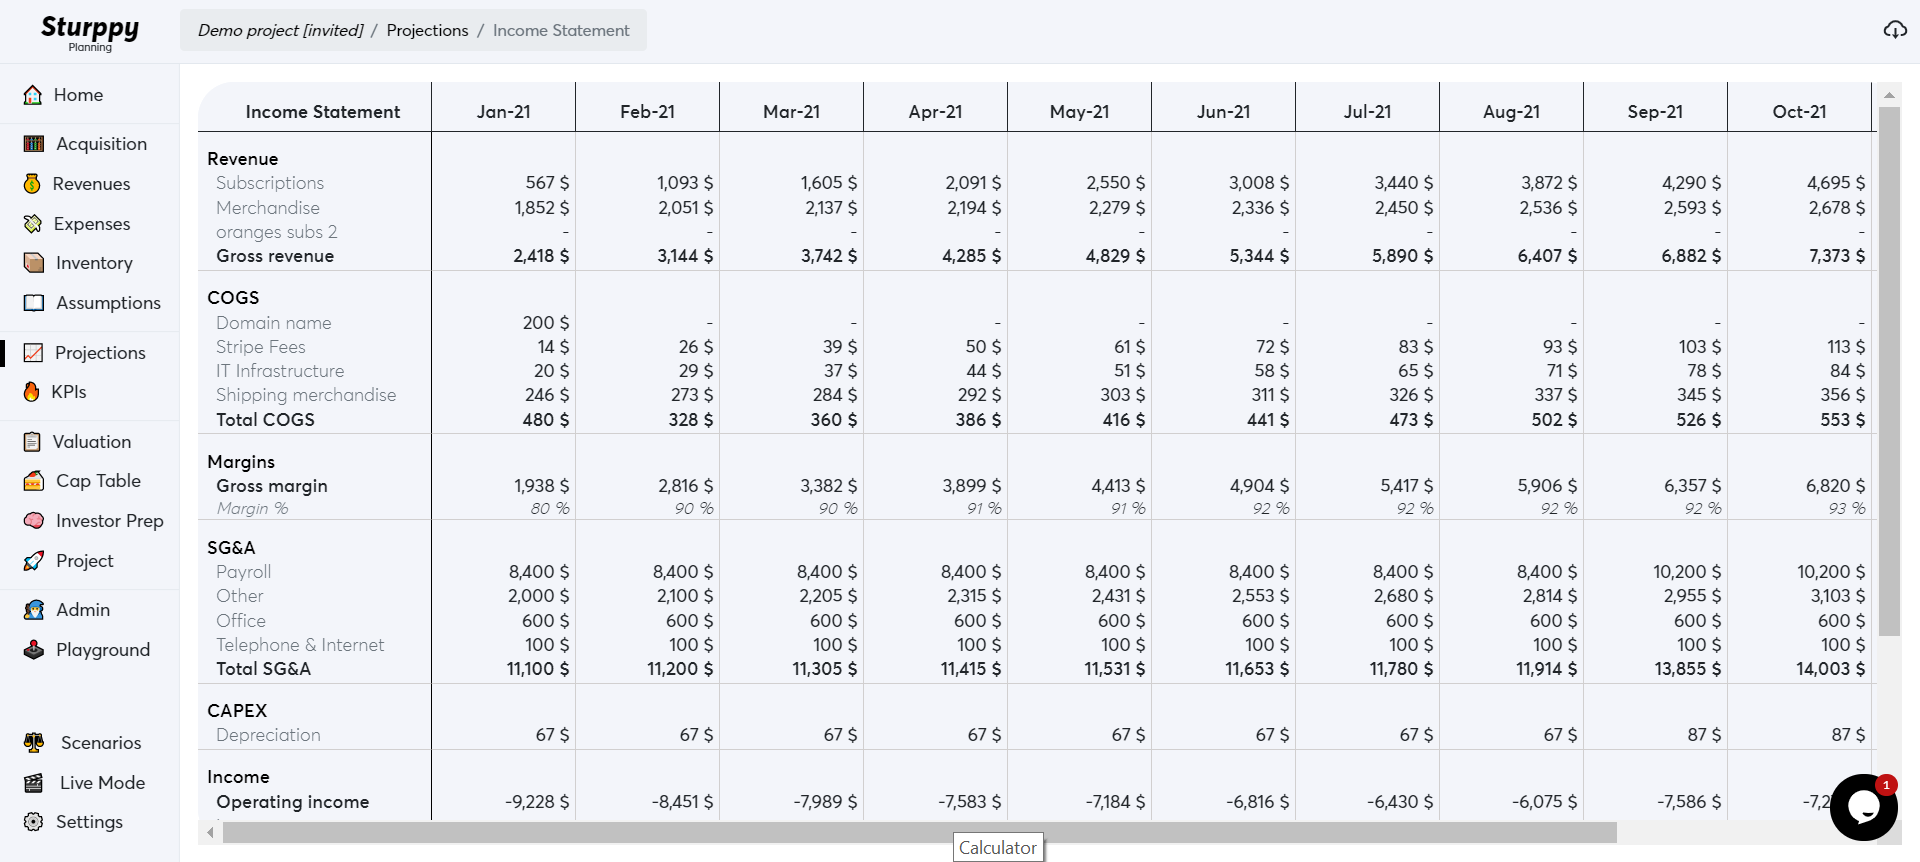
These are easily referenceable visualizations of each of the core financial statements in your model. When you click on one of them, you'll be presented with a spreadsheet version of your financial model. Here's what the income statement looks like:
Clicking into each of the projections will give you the formalized, spreadsheet version of your income statement that financial analysts the world over know and love. In the upper right of the screen, you'll see a small "cloud" button. Clicking it will download the spreadsheet in Excel format so that you can share it with others.
KPIs (Key Performance Indicators)
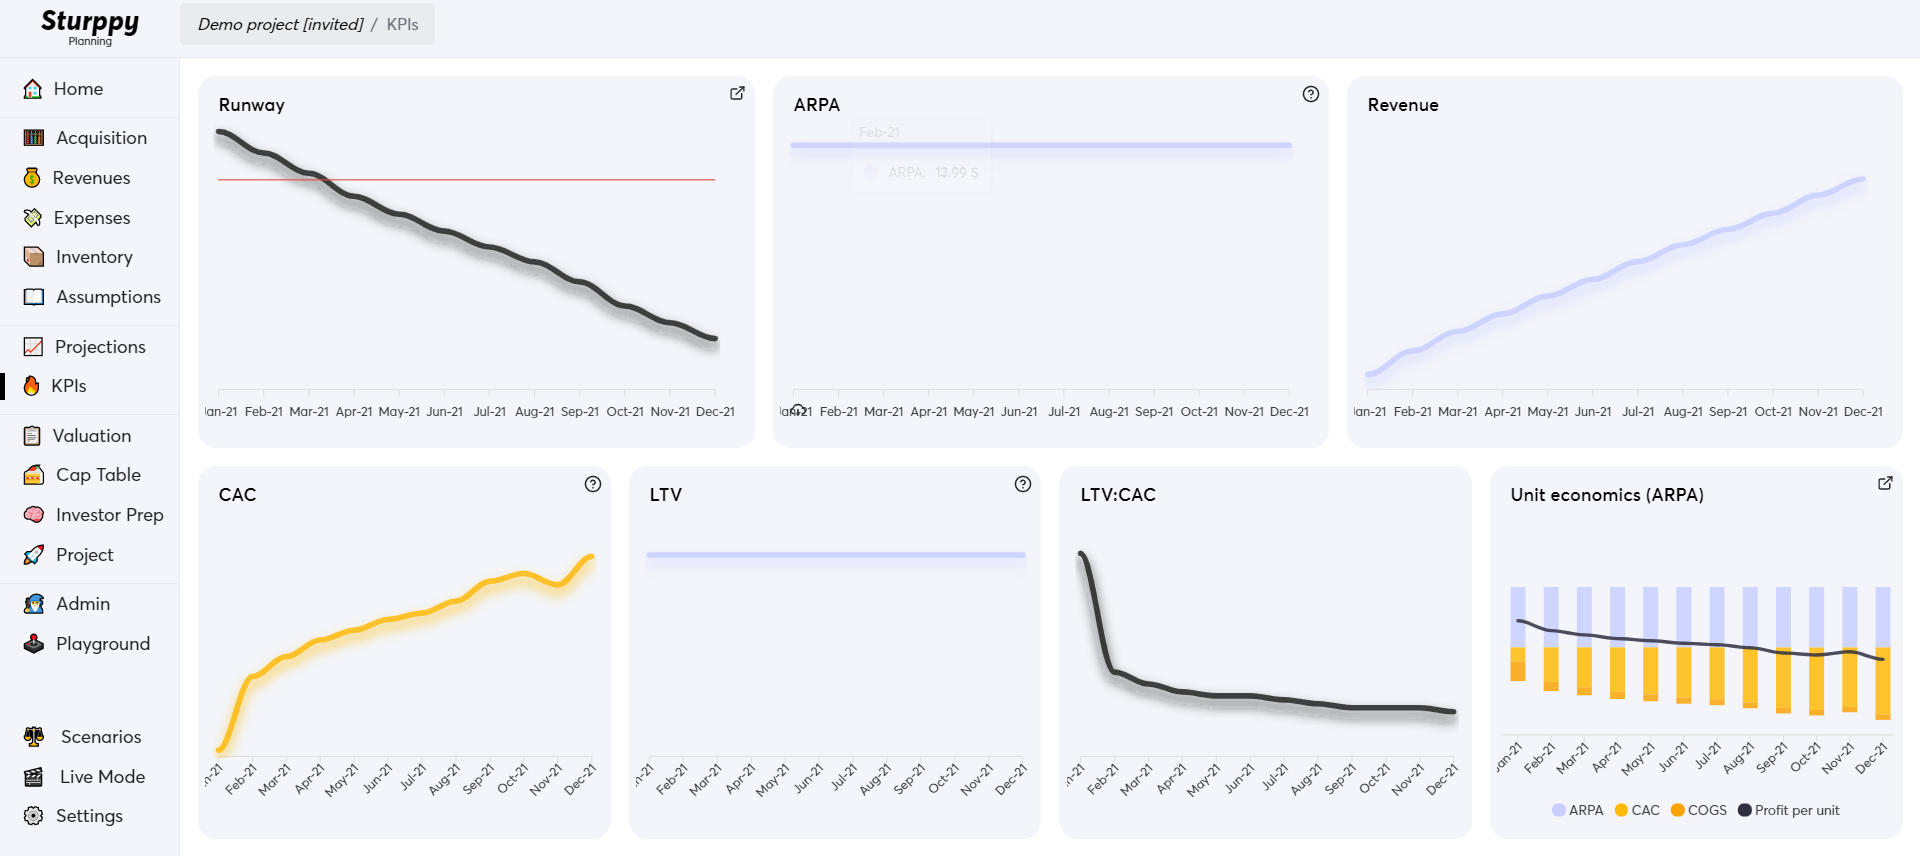
The KPIs (Key Performance Indicators) section, also located on the Navigation bar, is similar to the Projections section but contains important KPIs that can help you understand how your model projects your business will perform. We've selected the most common and important KPIs across business types to include in Sturppy, which you'll see on the KPIs main screen:
Some of the KPIs can be clicked on to view further detail. Those that are clickable are marked with the "open" symbol, shown here on the "Runway" and "Unit Economics" KPIs. Having quick and easy access to KPIs projected by your model can be helpful both in making operational decisions and in pitching investors - they will almost always ask about at least one of these metrics.
Last updated